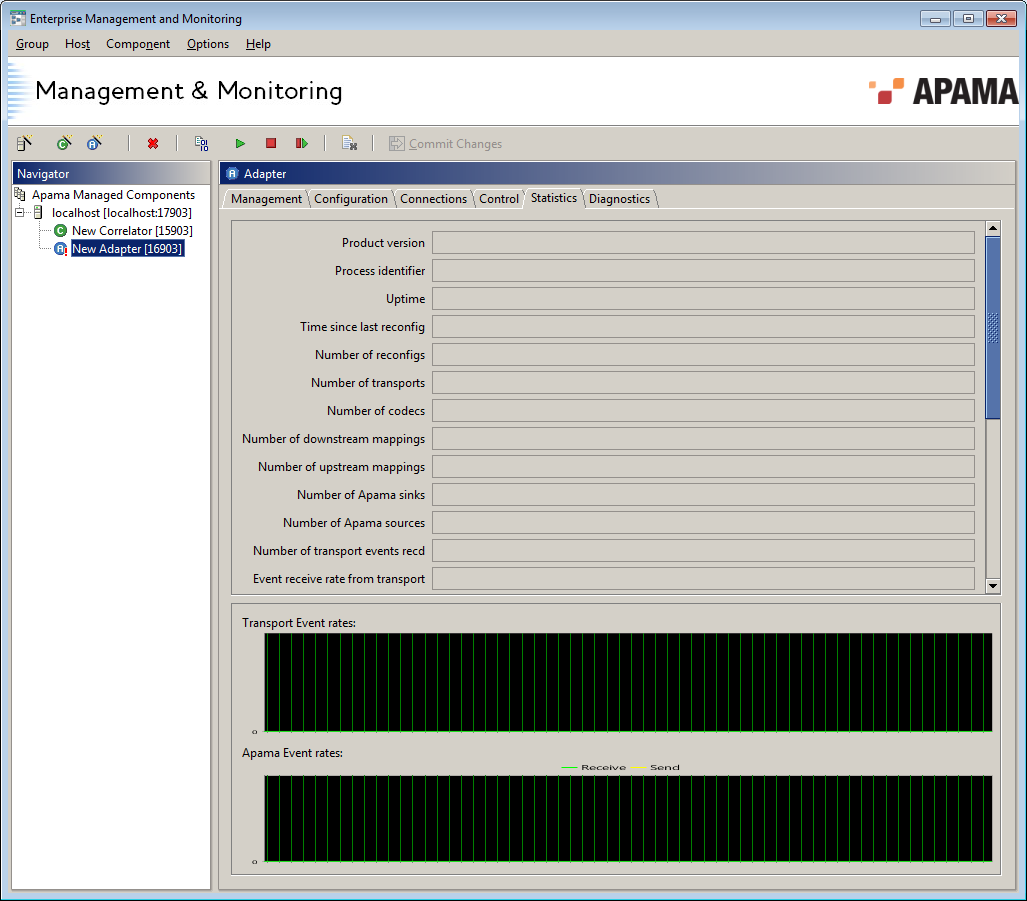
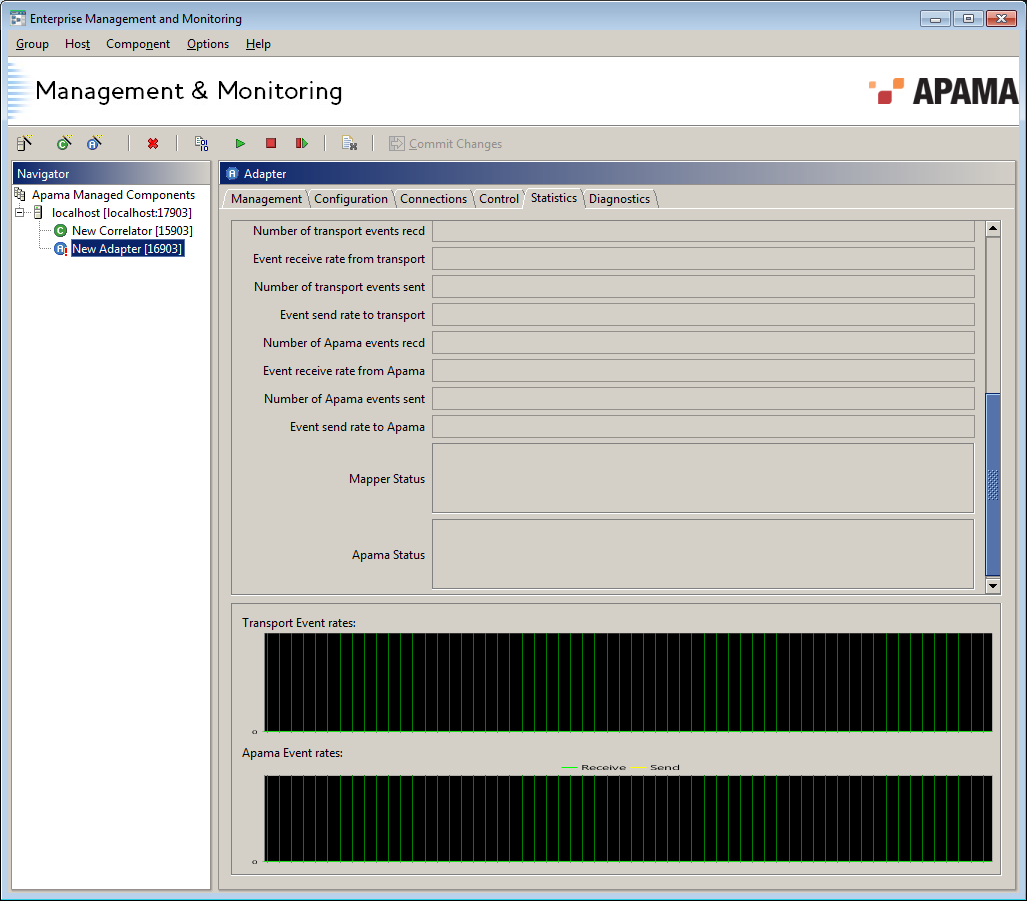
Statistics tab
This tab allows monitoring of the status of an operational IAF adapter.
Status information is refreshed regularly, by default, once a second. You can change this rate by changing the Component status display update interval (s) value on the Timing tab within the Preferences dialog. The Preferences dialog is available by selecting Options > Preferences… from the EMM menu.
No status information will be displayed if EMM cannot communicate with the IAF adapter selected. This is usually because the adapter has not yet been started or has been stopped. However, it could also be due to network failure. In this case, statistics will reappear once the connection is restored.
The following statistics are available:
 Product version
 – The Apama release number.
 Process identifier
 – The identifier assigned to this component by the operating system.
 Uptime
 – The time in seconds since this adapter was started. This time is maintained and reported by the component itself, so if the adapter was started independently of EMM and only managed by EMM later, the value would still be accurate.
 Time since last reconfig
 – The time in milliseconds since this adapter was last ‘reconfigured’, that is, reset with a new configuration file.
 Number of reconfigs
 – The total number of reconfigurations.
 Number of transports
 – The total number of Transport Plugins active in this adapter.
 Number of codecs
 – The total number of Codec Plugins active in this adapter.
 Number of downstream mappings
 – The total number of mapping rules set up in the adapter’s semantic mapper for downstream (from an external message source into Apama events) event mappings.
 Number of upstream mappings
 – The total number of mapping rules set up in the adapter’s semantic mapper for upstream (from Apama events into an external message sink) event mappings.
 Number of Apama sinks
 – The number of Apama correlators that the adapter is sending events to.
 Number of Apama sources
 – The number of Apama correlators that the adapter is receiving events from.
 Number of transport events recd
 – The total number of messages received by the adapter’s transport Plugins from external message sources (i.e. downstream).
 Event receive rate from transport
 – The number of messages per second currently being received by the adapter’s transport plug-ins. This value is computed with every status refresh and is only an approximation.
 Number of transport events sent
 – The total number of messages sent out by the adapter’s Transport Plugins to external message sinks (i.e. upstream).
 Event send rate to transport
 – The number of messages per second currently being sent out by the adapter’s Transport Plugins. This value is computed with every status refresh and is only an approximation.
 Number of Apama events recd
 – The total number of Apama events received by the adapter from Apama for upstream conversion.
 Event receive rate from Apama
 – The number of Apama events per second currently being received by the adapter from Apama. This value is computed with every status refresh and is only an approximation.
 Number of Apama events sent
 – The total number of Apama events sent to Apama by the adapter because of a downstream conversion.
 Event send rate to Apama
 – The number of Apama events per second currently being sent to Apama by the adapter. This value is computed with every status refresh and is only an approximation.
 Mapper Status
 – Indicates whether the adapter’s semantic mapper has started.
 Apama Status
 – Indicates whether the adapter has contacted the Apama sinks and sources specified in the Configuration File.
The four event rate statistics are also displayed graphically over the last 60 seconds at the bottom of the Statistics tab in the two graphs: Transport Event rates and Apama Event rates.
The following two illustrations show the top and bottom portions of the Statistics tab for adapters.

