Creating scenario instances visualized by the Statistical Arbitrage main dashboard
The Create dashboard in the Statistical Arbitrage dashboard project is subordinate to the main dashboard; it is intended to be accessed only from the main dashboard. Although it is possible to open the Create dashboard directly in Dashboard Viewer main window, you should not do so. Subordinate dashboards are typically dependent on context created by the parent dashboard and should only be accessed as intended by the creator of the dashboard project.
Follow these steps to create scenario instances that are visualized by the Statistical Arbitrage main dashboard:
1. Accept the defaults and click the Create button in the Create dashboard.
2. Click the Create button in the main dashboard again.
3. Enter MSFT in the Instrument1 field and ORCL in the instrument2 field.
4. Click on a row of the Summary of All Strategies table in the main dashboard.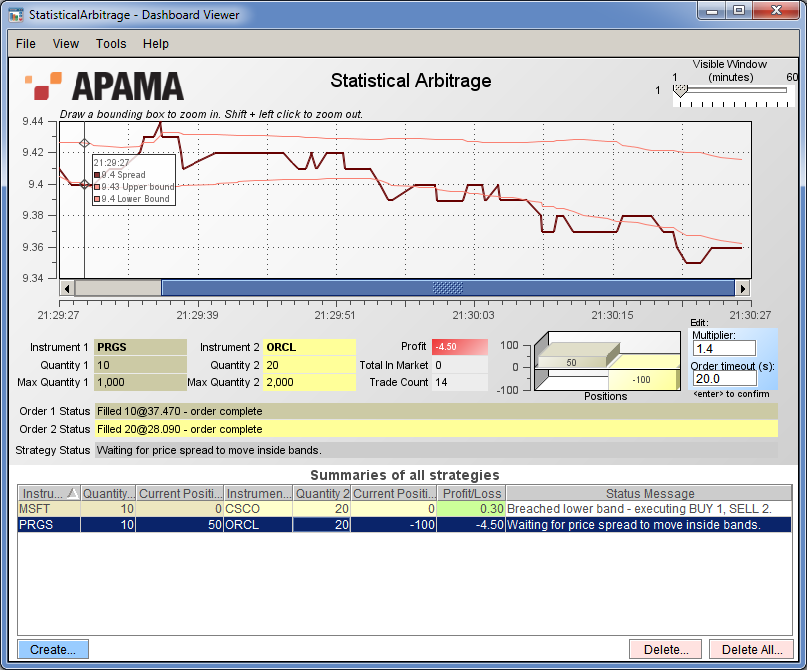
The data used for charting is stored in the Dashboard Viewer. As the Viewer runs, it accumulates historical data for display in charts. If you exit and restart the Dashboard Viewer, previously displayed historical data is not available.
Copyright © 2013
Software AG, Darmstadt, Germany and/or Software AG USA Inc., Reston, VA, USA, and/or Terracotta Inc., San Francisco, CA, USA, and/or Software AG (Canada) Inc., Cambridge, Ontario, Canada, and/or, Software AG (UK) Ltd., Derby, United Kingdom, and/or Software A.G. (Israel) Ltd., Or-Yehuda, Israel and/or their licensors.