Developing Apama Applications > Using Apama Studio > Profiling EPL Applications > The Apama Profiler perspective > Viewing EPL code
Viewing EPL code
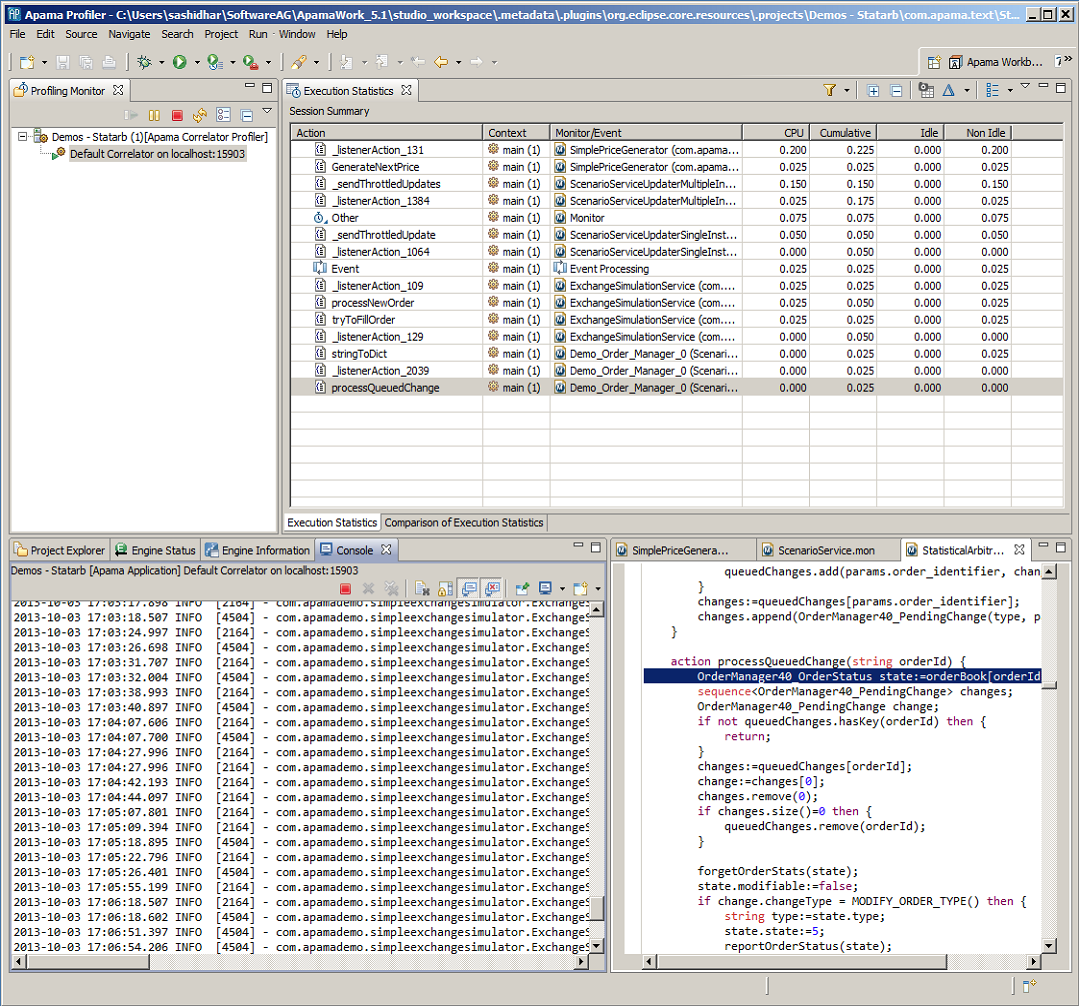
In the Execution Statistics view you can display the EPL code for a specific action or listener. Only the action-level entries that are shown with the code icon [ ] are able to display the associated code. There are other entries, such as garbage collector timings (that is, GC-mark, GC etc.), events and others for which there is no code association.
To display the code for an action or listener:
In the Execution Statistics view, double-click the action or listener for which you want to view the code. The EPL source file containing the code for the action or listener opens (if it is not already open) in the EPL editor.
Copyright © 2013 Software AG, Darmstadt, Germany and/or Software AG USA Inc., Reston, VA, USA, and/or Terracotta Inc., San Francisco, CA, USA, and/or Software AG (Canada) Inc., Cambridge, Ontario, Canada, and/or, Software AG (UK) Ltd., Derby, United Kingdom, and/or Software A.G. (Israel) Ltd., Or-Yehuda, Israel and/or their licensors.