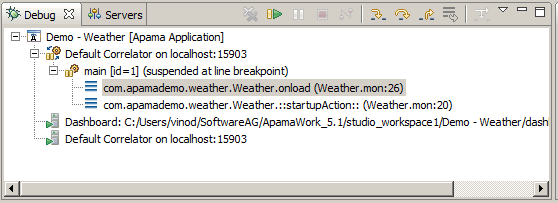
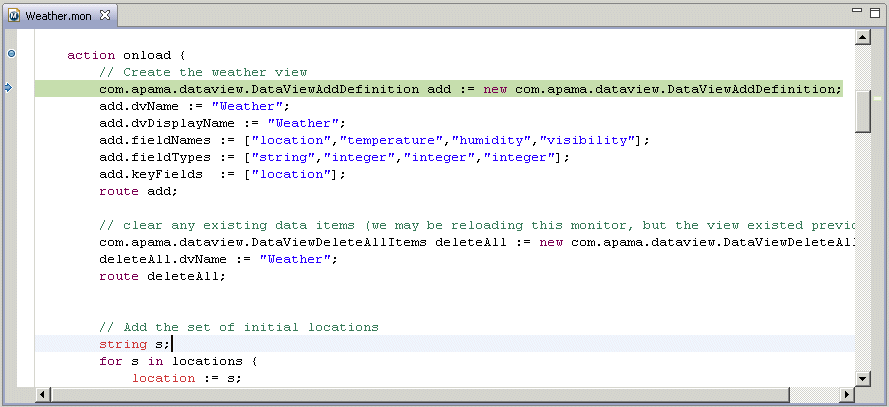
Also, when a breakpoint is reached, the EPL editor indicates the breakpoint in the code with an arrow in the left margin. The line of code that will be executed next is highlighted.
When a stack frame is highlighted in the
Debug view, the
Variable view displays the names and values of the associated variables, see
Variables view.

 Remove All Terminated Launches
 — Clears all terminated debug targets from the
Debug view display.

 Resume
 — Resumes a suspended debug target.

 Suspend
— Halts the execution of currently selected target.

 Terminate
 — Terminate the selected debug target.

 Step Into
 — Execute the current line and proceed to the next statement.

 Step Over
 — Steps over the highlighted statement and continues executing at the next line either in the same method or (if at the end of a method) continues in the method from which the current method was called.

 Step Return
 — Steps out of the current method. This stops execution after exiting the current method.


