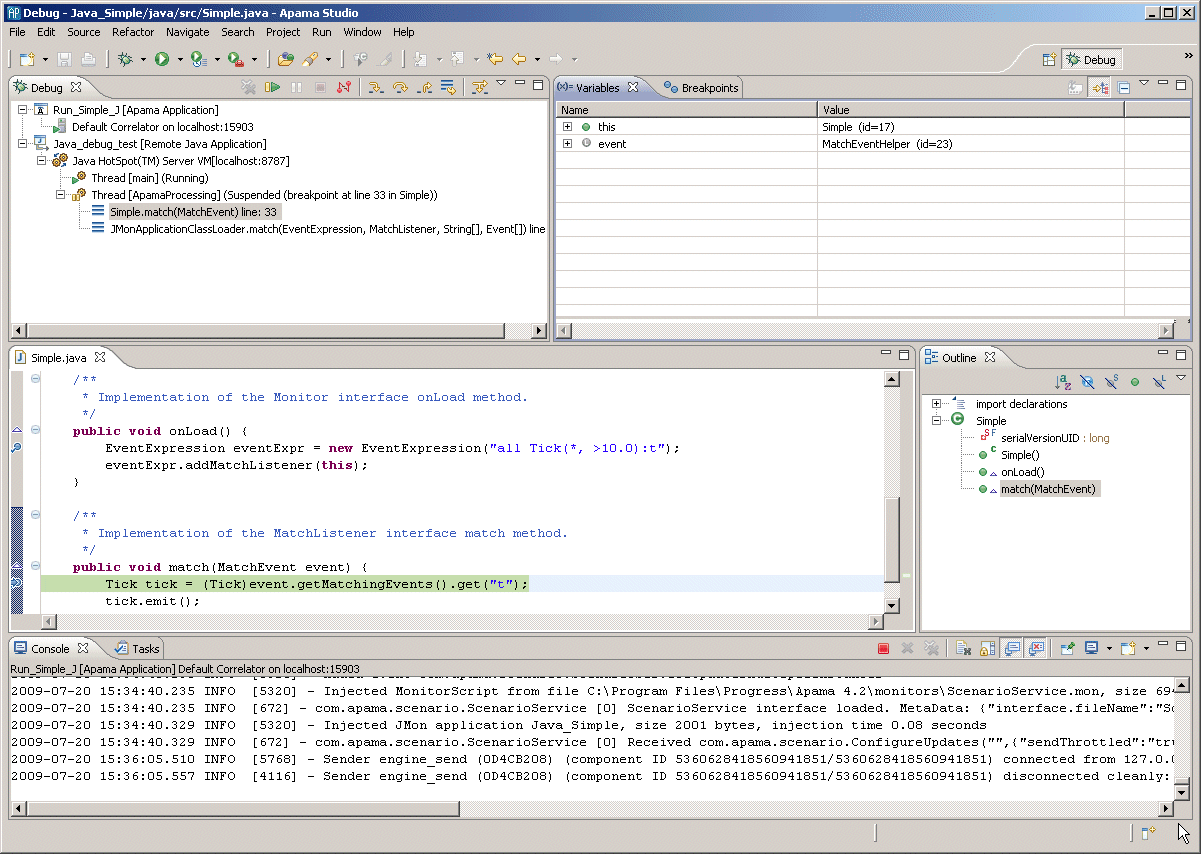
Debug perspective
The Debug perspective appears automatically when you start a debug session. The default Debug perspective has five panels that you can use for debugging:

The top-left panel is the
Debug view which shows the application’s stack frame. See
Using the Debug view.
The middle-left panel is the code editor view.
The middle-right panel is the code
Outline view.
The bottom panel includes the standard tabs for the console output, tasks, errors, problems, search results, display, and so on.
Copyright © 2013
Software AG, Darmstadt, Germany and/or Software AG USA Inc., Reston, VA, USA, and/or Terracotta Inc., San Francisco, CA, USA, and/or Software AG (Canada) Inc., Cambridge, Ontario, Canada, and/or, Software AG (UK) Ltd., Derby, United Kingdom, and/or Software A.G. (Israel) Ltd., Or-Yehuda, Israel and/or their licensors.