Statistics tab
This tab allows you to monitor of the status of an operational correlator.
Status information is refreshed regularly, by default, once a second. You can change this rate by changing the Component status display update interval (s) value on the Timing tab within the Preferences dialog. The Preferences dialog can be accessed from the Preferences… option from the Options menu on the Menubar.
No status information will be displayed if EMM cannot communicate with the selected correlator. If this is the case it is usually because the correlator has not yet been started or has been stopped. However, it could also be due to network failure. In this situation, statistics will reappear once the connection is restored.
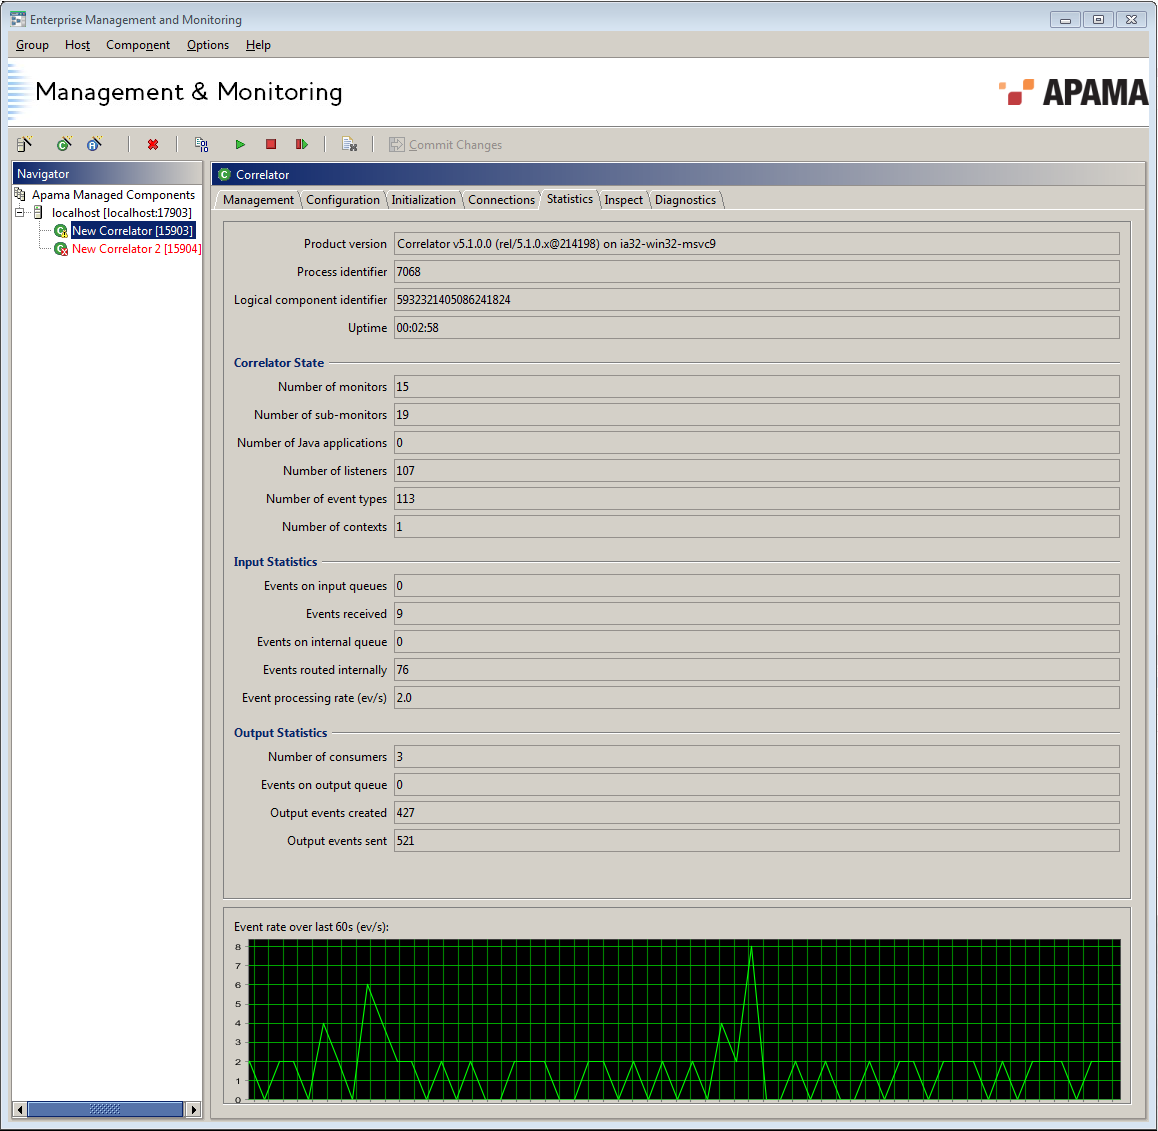
You may need to scroll the display to view all the information on the Statistics tab. The following illustration shows the Statistics tab for an active correlator.
The Statistics tab displays the following information:
 Product version
 — The Apama release number.
Process identifier — The identifier assigned to this component by the operating system.
Logical component identifier – A numeric identifier for this component. This is useful for matching components with information contained in log files.
Uptime(s) – The time in seconds since this correlator was started. This time is maintained and reported by the component itself, so if the correlator was started independently of EMM and only managed by EMM later, the value would still be accurate.
Number of monitors – The current number of Apama monitors injected and instantiated inside the correlator. This figure changes upwards and downwards as monitors are injected, deleted or just expire.
Number of sub-monitors – The number of Apama sub-monitors. Sub-monitors are created by ‘spawn’ actions within the monitor EPL code. This figure changes upwards and downwards as sub-monitors are spawned, killed or just expire.
Number of Java applications – The number of Apama Java applications currently loaded into the correlator. Apama Java applications do not expire, so this value only decreases when they are explicitly unloaded.
Number of listeners – The number of event listeners created by monitors and sub-monitors in EPL code and by Apama Java applications.
Number of event types – The total number of event types defined within the correlator. This figure decreases when event types are deleted from the correlator.
Number of contexts – The number of contexts in the correlator. This includes the main context plus any created contexts.
Events on input queue – Across all contexts, the total number of events on input queues.
Events received – The total number of events ever received by the correlator. This value is preserved by a checkpoint, so if the state of the correlator is restored from a checkpoint file it will reflect the total number of the events seen by the correlator from which the checkpoint was originally made.
Events on internal queue – Across all contexts, the total number of routed events waiting to be processed. The internal routing queue is a high priority queue that is used when events are internally routed by the
route instruction in EPL code or in Apama Java applications. For each context, the correlator processes events on the internal queue before processing other events on the input queue.
Events routed internally – Across all contexts, the total number of events that have veen routed since the correlator was started. This value is preserved by a checkpoint, so if the state of the correlator is restored from a checkpoint file it will reflect the total number of the events routed by the correlator from which the checkpoint was originally made.
Event processing rate (ev/s) – The number of events per second currently being processed by the correlator. This value is computed with every status refresh and is only an approximation.
Number of consumers – The number of event consumers registered with the correlator to receive events emitted by it.
Events on output queue – The number of events waiting on the output queue to be dispatched to any registered event consumers.
Output events created – The total number of output events created by the correlator. This value is preserved by a checkpoint, so if the state of the correlator is restored from a checkpoint file it will reflect the total number of output events created by the correlator from which the checkpoint was originally made.
Output events sent – The total number of output events dispatched to event consumers by the correlator. This figure varies from the preceding statistic as an output event might be sent to multiple event consumers. This value is preserved by a checkpoint, so if the state of the correlator is restored from a checkpoint file it will reflect the total number of output events sent out by the correlator from which the checkpoint was originally made.
A graph showing the values taken by the Event rate statistic over the last 60 seconds is displayed below the figures.
Copyright © 2013
Software AG, Darmstadt, Germany and/or Software AG USA Inc., Reston, VA, USA, and/or Terracotta Inc., San Francisco, CA, USA, and/or Software AG (Canada) Inc., Cambridge, Ontario, Canada, and/or, Software AG (UK) Ltd., Derby, United Kingdom, and/or Software A.G. (Israel) Ltd., Or-Yehuda, Israel and/or their licensors.