Creating a scenario summary table
Table objects are often attached to a scenario instance table in order to provide a summary view of the instances.
To create a summary table for a scenario, you add a table object to a dashboard and attach its valueTable property to a scenario instance table. When you define the attachment, you can select the scenario variables to be displayed; these will be the columns of the table. You can also specify a filter to show only a subset of scenario instances.
Note that, by default, users are authorized to view only those dashboards that they created. Regardless of filter settings, users will not be able to see instances they did not create.
To create a typical scenario summary table, create a new dashboard and perform the following steps.
1. From the Tables tab in the Object Palette, select the Table object and add it to the dashboard canvas.
2. In the Object Properties panel, double click the valueTable property.
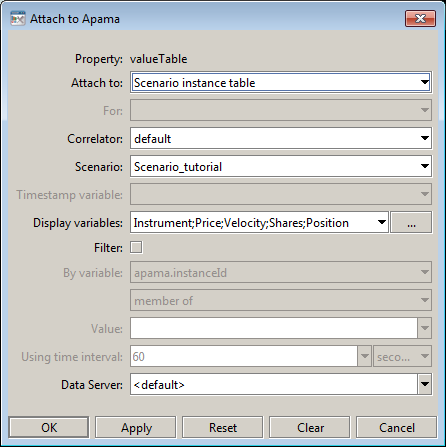
This displays the Attach to Apama dialog. Attach the table object’s valueTable property to a scenario instance table, for example as follows:
3. Select the autoResizeFlag property and enable it by clicking the check box in the Property Value column.
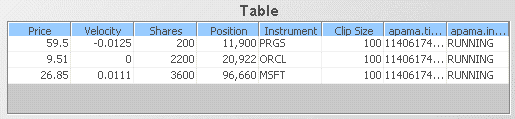
4. Resize the table such that all columns are visible. (You resize the table by selecting it and dragging the handles.)
The table now displays all the input and output variables of all instances of the specified scenario, as well as the special fields Dashboard Builder adds, including apama.timestamp which indicates the time the instance last changed.
Often, you will not want to display all scenario variables or the special fields in a summary table. The steps that follow show how to specify the variables to be displayed.
5. Double click on the valueTable property to display the Attach to Apama dialog.
By default the display variables field is set to the wildcard “*” indicating that all the variables are to be displayed. Next to the field is a button labeled “…” that provides access to the Select Columns dialog.
6. Click on the “…” button to display the Select Columns dialog.
7. In the Select Columns dialog select and order the columns as follows.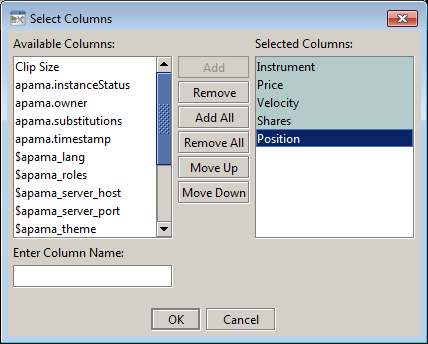
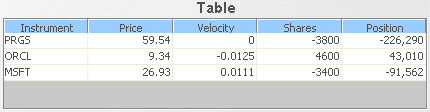
8. Click OK in the Select Columns dialog and OK in the Attach to Apama dialog.
The table object will now display only those columns you selected.
By default a table will display a maximum of 100 rows. If a dashboard needs to show more than 100 instances of a scenario, change the value of the maxNumberOfRows property. The maximum value for this property is 131072.
By default a table is unsorted. If you want a table to have a default sort order, set the sortColumnName property to the name of the scenario variable to sort by, such as Price.
Copyright © 2013
Software AG, Darmstadt, Germany and/or Software AG USA Inc., Reston, VA, USA, and/or Terracotta Inc., San Francisco, CA, USA, and/or Software AG (Canada) Inc., Cambridge, Ontario, Canada, and/or, Software AG (UK) Ltd., Derby, United Kingdom, and/or Software A.G. (Israel) Ltd., Or-Yehuda, Israel and/or their licensors.