Stock charts
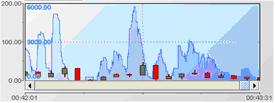
Stock charts provide the ability to view open, high, low, and close values, at a specified time interval, for a variable of a scenario instance or field of a DataView item. Stock charts support the same zooming, scrolling, and maximum-number-of-values behavior as trend charts.
Stock chart
Copyright © 2013
Software AG, Darmstadt, Germany and/or Software AG USA Inc., Reston, VA, USA, and/or Terracotta Inc., San Francisco, CA, USA, and/or Software AG (Canada) Inc., Cambridge, Ontario, Canada, and/or, Software AG (UK) Ltd., Derby, United Kingdom, and/or Software A.G. (Israel) Ltd., Or-Yehuda, Israel and/or their licensors.