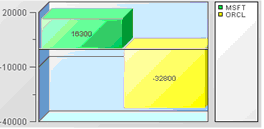
Pie and Bar charts
Pie and Bar charts are typically used to display summary information about one or more scenario instances.
If enabled in the Builder, a pie or bar chart may also support drilldown to display detailed information about a scenario instance. To drill down on an instance or item that is displayed in a pie or bar chart, click on it.
Copyright © 2013
Software AG, Darmstadt, Germany and/or Software AG USA Inc., Reston, VA, USA, and/or Terracotta Inc., San Francisco, CA, USA, and/or Software AG (Canada) Inc., Cambridge, Ontario, Canada, and/or, Software AG (UK) Ltd., Derby, United Kingdom, and/or Software A.G. (Israel) Ltd., Or-Yehuda, Israel and/or their licensors.