Display
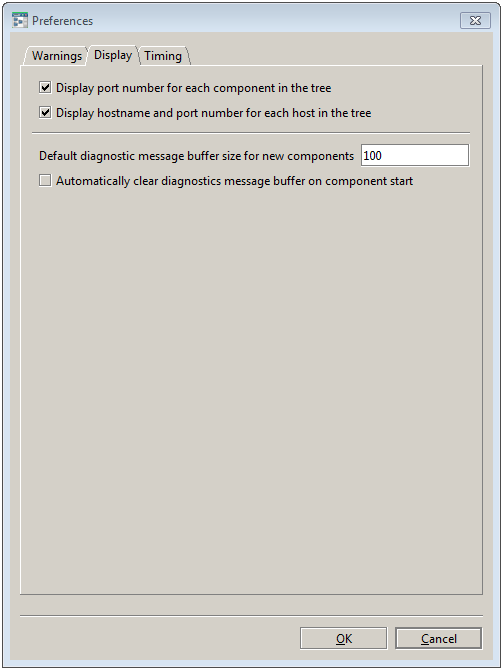
The illustration below shows the Display tab.
The following settings may be configured from the Display tab of the Preferences dialog:
 Display port number for each component in the tree
 – If enabled, the listening port for each component will be displayed alongside its name in the Navigation Pane. This makes it easier to check for conflicts (since the port number must be unique per host).
 Display hostname and port number for each host in the tree
 – If enabled, the actual hostname (as opposed to its EMM descriptive name) and the port its Sentinel Agent is listening on are displayed alongside that host’s name in the Navigation Pane. This makes it easier to avoid conflicts in host management.
 Default diagnostic message buffer size for new components
 – Each component has a
Diagnostics tab in its Display Pane, containing a list of the most recent status messages for the component. The maximum number of messages (after which the oldest will be discarded) may be configured on a per-component basis; this
Preferences option specifies the default size of the message buffer that is assigned to new components. By default the buffer size is
100 lines. Minimum size is 1 line.
 Automatically clear diagnostics message buffer on component start
 – If enabled, removes all log messages for a component when it starts. This is useful during development work, but it should not be enabled in a production system.
Copyright © 2013
Software AG, Darmstadt, Germany and/or Software AG USA Inc., Reston, VA, USA, and/or Terracotta Inc., San Francisco, CA, USA, and/or Software AG (Canada) Inc., Cambridge, Ontario, Canada, and/or, Software AG (UK) Ltd., Derby, United Kingdom, and/or Software A.G. (Israel) Ltd., Or-Yehuda, Israel and/or their licensors.

