Radar graph
Radar graphs visualize tabular data that has one or more numerical columns. Typically, the visualized data also has one non-numerical column whose values are used as graph labels that uniquely identify each row.
A radar graph can visualize data in either of two ways:

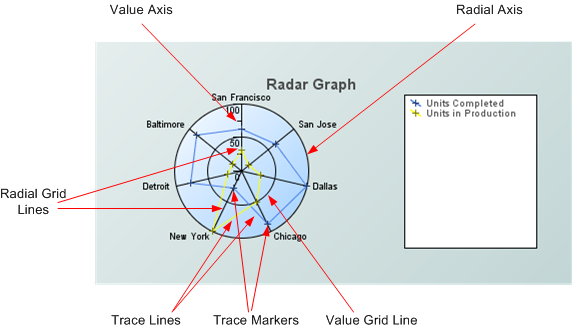
Row series visualization: The graph displays one radial grid line for each numeric column of the visualized data, and one trace for each row of the data. A given trace intersects a given radial grid line at a distance (from the graph’s center) that is proportional to the value of the grid line’s corresponding column for the trace’s corresponding row. A marker is displayed at the point of intersection.
Column series visualization: The graph displays one radial grid line for each row of your data attachment, and one trace for each numeric column of your data attachment. A given trace intersects a given radial grid line at a distance (from the graph’s center) that is proportional to the value of the trace’s corresponding column for the grid line’s corresponding row. A marker is displayed at the point of intersection.
Use the
valueTable property to attach data to a radar graph. Use the
rowSeriesFlag property to specify row series or column series visualization.
When a radar graph is selected in the Builder canvas, the Object Class Name that appears at the top of the Object Properties pane is obj_radar.
The Object Properties panel organizes radar graph properties into the following groups:
Copyright © 2013
Software AG, Darmstadt, Germany and/or Software AG USA Inc., Reston, VA, USA, and/or Terracotta Inc., San Francisco, CA, USA, and/or Software AG (Canada) Inc., Cambridge, Ontario, Canada, and/or, Software AG (UK) Ltd., Derby, United Kingdom, and/or Software A.G. (Israel) Ltd., Or-Yehuda, Israel and/or their licensors.