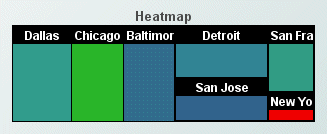
Heat map
Heat maps visualize data by displaying rectangles of various sizes and colors. Complex heat maps display a hierarchy of rectangles, where a rectangle’s level in the hierarchy is represented by its level of geometric nesting within other rectangles.
Heat maps visualize tabular data that contains one or more index columns as well as one or more numerical columns.
You specify the data to be visualized with the valueTable property.
You designate the index columns by specifying a column name or list of column names as the value of the property nodeIndexColumnNames.
If there are two or more non-index numerical columns, the first is the size-data column and the second is the color-data column. If there is only one non-index numerical column, it serves as both the size-data column and the color-data column.
Copyright © 2013
Software AG, Darmstadt, Germany and/or Software AG USA Inc., Reston, VA, USA, and/or Terracotta Inc., San Francisco, CA, USA, and/or Software AG (Canada) Inc., Cambridge, Ontario, Canada, and/or, Software AG (UK) Ltd., Derby, United Kingdom, and/or Software A.G. (Israel) Ltd., Or-Yehuda, Israel and/or their licensors.

