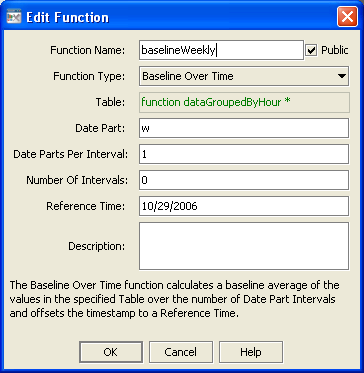
Baseline Over Time
Calculates a baseline average of the values in the specified table over the specified number of specified date part intervals, and offsets the timestamp to a specified reference time.
Arguments
The function has the following arguments:
 Table
Table: Data table for which the baseline is to be calculated. The specified table must contain a time column and a number column.
 Date Part
: Text string specifying the date unit to use. Enter
s,
m,
h,
d,
w,
M,
q, or
y, for seconds, minutes, hours, days, weeks, months, quarters, or years. If left blank, the argument defaults to seconds.
 Date Parts Per Interval
: Number of date parts in each interval over which the baseline is to be calculated.
 Number Of Intervals
: Number of intervals over which the baseline is to be calculated. If this argument is set to
0, the baseline is calculated over all the data in the table.
 Reference Time
: After the baseline average has been calculated over the range of data specified, all values in the resulting time column are offset to start at the given reference time. This provides an easy way for the baseline to be plotted in a trend graph against a current set of values.
The function returns a table.
Example
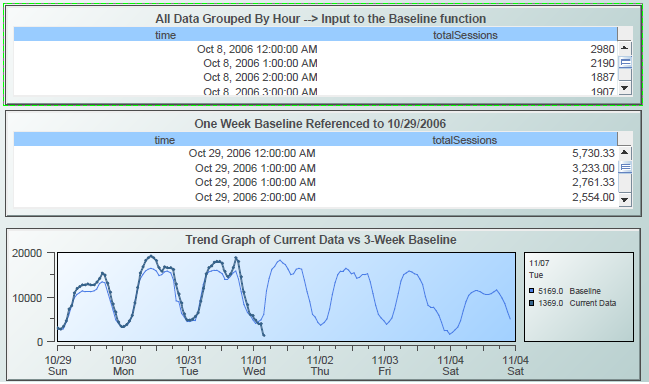
The trend graph below is attached to the function defined by the following dialog. In the trend graph, the thin, light blue line is the baseline, the average of the data over three one-week periods. The dark blue line is the current data. The first table's data table is attached to the argument Table. The second table shows the baseline data. Note that the current data for Sunday is lower than the rest of the current data. The graph shows that this is not anomalous, since the baseline data for Sunday is also lower than the rest of the baseline data.

