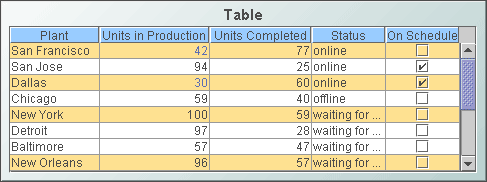
Standard tables
Standard tables display tabular data in a straightforward manner. For each row of the data, there is a row of the displayed table; for each column in the data, there is a column in the displayed table, with the exception of those specified as hidden. Hidden columns can still be used in labels and drill-down substitutions.
Tables are particularly useful as a starting point for drill down. By default, tables are configured to set a number of predefined substitution variables when the end user activates drill down.
Use the
valueTable property to attach data to a standard table. Use the
columnsToHide property to specify columns to be omitted from the display.
Include a new line character (\n) in cell text to display multi-line text.
To copy displayed table data to the system clipboard so that it can be pasted into another application, right click and select Copy Table Values or Copy Cell Value.
This section covers the following table visualizations:

Table

Table with Row Labels

Table without Grid
These visualizations all share the same properties. They differ from one another only with regard to their default values for these properties. When one of these objects is selected in the Builder canvas, the Object Class Name that appears at the top of the Object Properties pane is obj_table02.
See also
Rotated tables , which covers a table with a different set of properties.
The Object Properties panel organizes standard table properties into the groups below.
The rule's action is performed on those cells specified by the first field that bear the specified comparison relation to the specified value, or else for the rows that contain those cells, or for the columns that contain those cells (depending on how the Target field is set; see below).
The third field is populated with values from the table's data attachment, based on the selected comparison field, along with the options top(5) and bottom(5). Select top(5) to specify the five highest values among the cells specified by the first Condition field. Select bottom(5) to specify the five lowest values among the cells specified by the first Condition field. Once you make a selection, you can edit the number in parentheses.
 Action
: Use this field to specify the rule's action.
In the first drop down menu, select one of the following:
 Set Background Color To
: controls the color of cell backgrounds.
 Set Font Color To
: controls the color of cell text.
 Hide Rows
: controls the visibility of the rows containing the cells specified by the
Condition fields.
 Display Image
: replaces cell values with an image. Select the name of the image file from the drop down menu, or enter the pathname of the file (a
.gif,
.jpg, or
.png file). The drop down menu contains the names of image files located in the current directory (typically, the
dashboards directory of your project directory, under your Apama installation's work directory), as well as image files located in the first level of subdirectories. If you enter a pathname, use an absolute pathname or a pathname that is relative to the current directory.
In the second drop down menu, choose which color to apply to the background or font, enter or select an image, or enter the name of a dashboard variable to use as the value of this field.
 Target
: Use this field to control the cells to which the action is applied. Select one of the following from the drop down list:
 Rows
Rows: applies the action to the rows that contain the cells specified in the
Condition fields.
 Cells
Cells: applies the action to the cells specified in the
Condition fields.
 Columns
: applies the action to the columns that contain the cells specified in the
Condition fields.
You must select Rows if the action is Hide Rows.
In the Filter Properties dialog, double-click on an existing rule to edit it. Click the Remove button to delete a rule. Click Clear to remove all rules. Use the Move Up and Move Down buttons to control the order in which the rules are applied.
This property is in the Alert property group.

