Adding thresholds
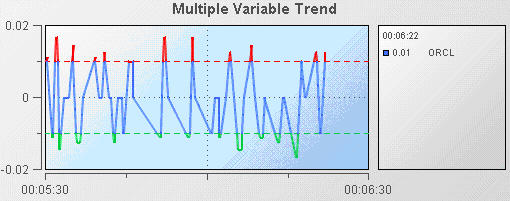
Often you will want to know when the value of a DataView field is outside a specified range. For example you may want to know when the price of a stock is above or below some threshold. Trend charts enable you to display thresholds and show when variables cross them. The following illustration from the Trend Thresholds tutorial sample shows a typical example.
Here the Velocity of an instance of the tutorial is being charted and high and low thresholds of .01 and -.01 are being displayed.
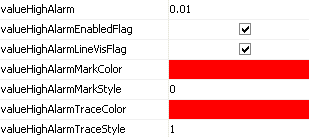
Trend charts support four thresholds that are specified with the properties; valueHighAlarm, valueLowAlarm, valueHighWarning, and valueLowWarning. These properties can be set to fixed values or attached to DataView fields. Each threshold has a set of properties for configuring it. Following are the properties for the valueHighAlarm property.

To recreate this sample create a new dashboard and perform the following steps
1. From the Trends tab in the Object Palette, select the Threshold Trend object and add it to the dashboard canvas.
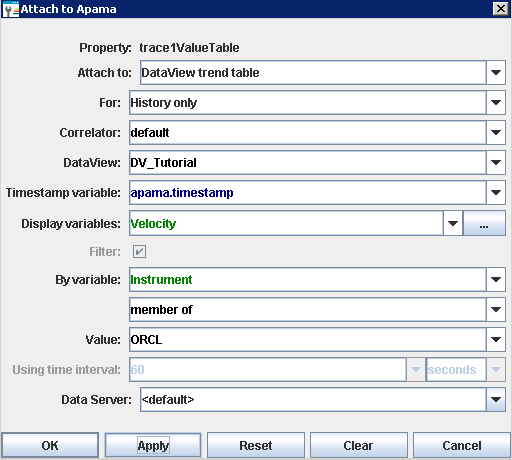
2. With the threshold trend object selected, in the Object Properties panel, select the trace1ValueTable property and attach it to Apama by specifying the following information:
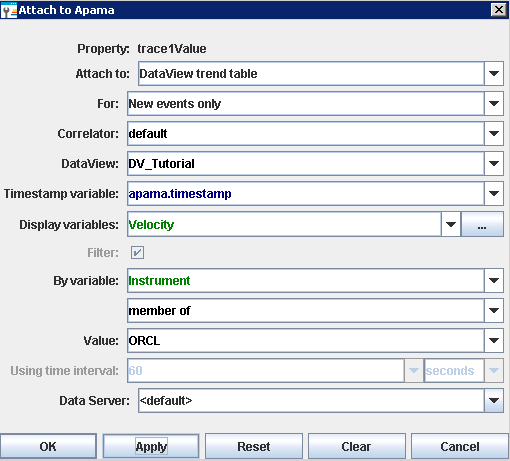
3. With the threshold trend object selected, in the Object Properties panel, select the trace1ValueValue property and attach it to Apama by specifying the following information:
The trace line will now show the Velocity of the instance of the tutorial DataView where Instrument equals ORCL.
4. Select the valueHighAlarm property and change its value to 0.01.
5. Select the valueLowAlarm property and change its value to -0.01.
Thresholds will now be displayed.
