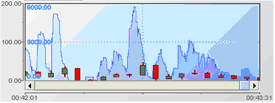
Stock charts
Stock charts provide the ability to view open, high, low, and close values, at a specified time interval, for a variable of a scenario instance or field of a DataView item. Stock charts support the same zooming, scrolling, and maximum-number-of-values behavior as trend charts.
Stock chart

