About Dashboards
Dashboards provide the ability to view and interact with applications running in a correlator. Dashboards contain charts and other objects that allow you to visualize the status, performance, and attributes of Apama applications including any scenarios and DataViews. Dashboards can also contain control objects for creating, editing, and deleting scenario instances, as well as for sending events to a correlator.
Dashboard displays are stored in .rtv files. A dashboard project includes .rtv, image, and audio files. A dashboard project is deployed in a single directory with one or more subdirectories containing the files of the project. To use a dashboard, the Dashboard Viewer must have access to all the files in the associated dashboard-project directory.
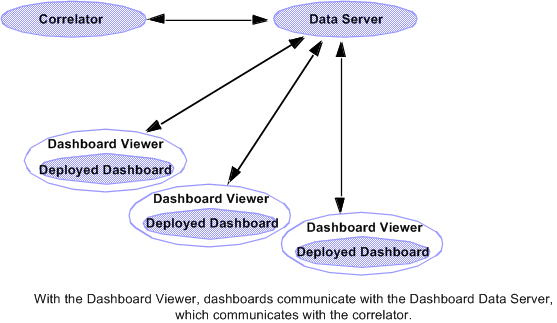
Deployed dashboards connect to a dashboard Data Server, which in turn connects to one or more correlators. The dashboard Data Server is the middle-tier between users and the correlator. It provides for both scalability and security. As the scenarios or DataViews in a correlator run, and their variables or fields change, update events are sent to dashboard Data Servers, which in turn send the data to all connected dashboards. When a dashboard receives an update event, it updates its display in real time to show the behavior of the application. User interactions with the dashboard, such as creating an instance of a scenario, result in control events being sent via the Data Server to the correlator.
The following diagram illustrates the runtime deployment of dashboards:
Runtime deployment of dashboards

