Sample use case
Consider a situation where you are getting real-time sensor data and you want to analyze this data. For the sake of simplicity, let us assume that there is only one sensor and that you are interested in the following:

You want to know the average value of the sensor readings over a period of time.

You want to detect sudden changes in the sensor readings using a defined threshold value.

You want to ensure that the sensor readings are within a certain range and that an alert is created if the readings go beyond that range. For example, you are getting pressure readings and you want to ensure that the maximum pressure does not go beyond the range that the device can handle.
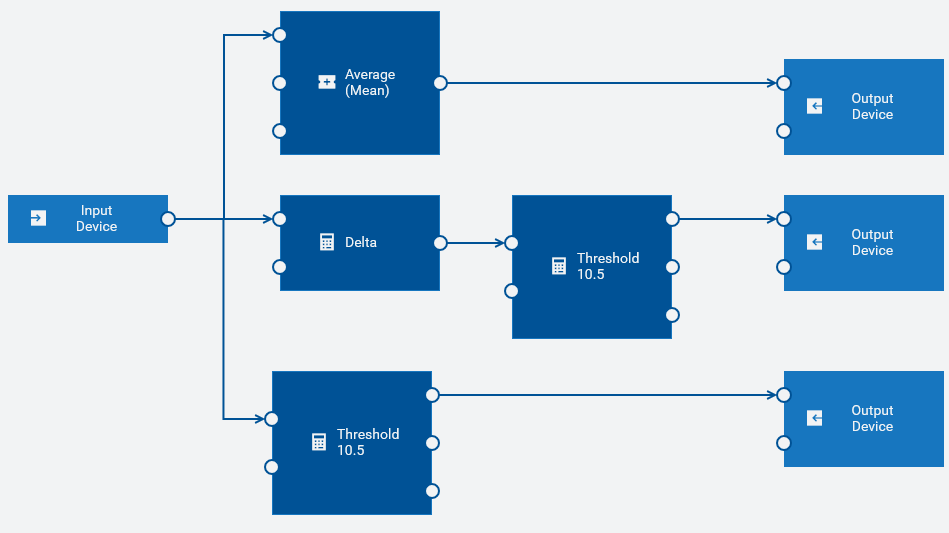
The model for this example has the following blocks:

An input block which shows
Input Device as the device name
The incoming data is in real time and continuous. The input block receives the data from the sensor. It passes the data to the Average (Mean), Delta and Threshold blocks. The input ports of these blocks are connected to the output port of the input block.

An
Average (Mean) block
This block finds the average (or mean) of the readings that it receives over a period of time and passes this to the connected output block.

A
Delta block
This block calculates the difference between successive input values and passes the calculated value to the connected Threshold block.

Two different instances of a
Threshold block
A Threshold block compares the input value against the defined threshold value to detect whether the input breaches the threshold or not.
The first instance is connected to the Delta block and reports a breach if the delta value goes beyond the threshold.
The second instance is connected to the input block and reports a breach if the input value is not within the threshold.

Three instances of an output block which show
Output Device as the device name
The first instance sends the average of the sensor reading.
The second instance generates an output if the values of successive sensor readings change by more than the configured threshold.
The third instance generates an output if the sensor value goes beyond the configured threshold.
