
When software runs, whoever operates it needs a way to see what it is doing and whether it is healthy without stopping it or reading its source code. This is the purpose of telemetry: the software continuously reports small pieces of information about its own activity, and separate tools collect and display that information. It is comparable to a car dashboard, which shows speed, fuel level, and warning lights while the engine keeps running.
OpenTelemetry (OTel) is an open, vendor-neutral standard for producing and transmitting telemetry. It is not a single program but a shared agreement on how telemetry is described so that any software can produce it and any tool can read it. It is maintained as an open industry project and is supported by all major monitoring tools.
OpenTelemetry organizes telemetry into three types, called signals:
Logs are timestamped text records of individual events, for example, a message indicating that a command was processed or that something failed. This is the familiar "log line".
Metrics are numbers measured over time, for example, the number of users currently active or the number of commands that have been processed. These are the values that can be displayed on a chart or a gauge.
Traces follow a request as it moves through a system and record the individual operations involved and their durations. They can help determine where time was spent during an operation.
Before a standard like this existed, every product used its own log and monitoring formats, and each monitoring tool had to be configured to understand each product separately. OpenTelemetry replaces these individual formats with one common language for all three signals, allowing the same data to be sent to many different tools without requiring a separate product-specific integration for each tool.
The telemetry is transmitted using a standard protocol called OpenTelemetry Protocol (OTLP). A typical setup has three parts: the application (for example a database) produces the telemetry and sends it out via OTLP; an OpenTelemetry Collector receives it and can filter, transform, and route it to one or more destinations; and one or more observability backends store and display the data, for example Grafana for dashboards, Loki for logs, Prometheus for metrics, or Tempo for traces. The architecture diagrams in Adabas OpenTelemetry Exporter and REST Server Exporter show this flow for the two Adabas exporters.
Because OpenTelemetry is an industry standard supported by all major backends, telemetry exported this way can be sent to whichever tools an organization already uses, and the backend can be changed without changing the application.
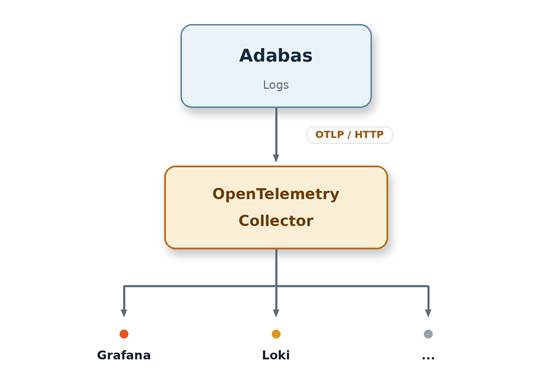
Adabas OpenTelemetry Export forwards Adabas telemetry to an OpenTelemetry Collector using OTLP/HTTP. It allows an existing observability platform, such as Loki or Grafana, to collect log records from the database without changing how the database itself runs.
Note
Adabas currently supports only the LOG signal.
This feature includes the following functionality:
Adabas log records are forwarded as OTLP log records with a severity level and optional trace correlation.
Every record contains the database ID so that telemetry from multiple databases served by one process can be distinguished in the backend.
Operating a database over long periods benefits from continuous, standardized observability. Exporting Adabas telemetry through OpenTelemetry allows you to monitor the database using the same tools that you already use for the rest of your systems instead of relying on a product-specific mechanism.
It offers the following benefits:
OTLP is an industry standard supported by all major observability backends, so the data can be consumed by the tools an organization already uses.
Every record contains the database ID, so telemetry from multiple databases can be distinguished and filtered by database in the backend.
The export status is reported through Adabas messages, so an administrator can determine whether the export started successfully, failed to start, or became unreachable.
Adabas exports its telemetry as OTLP log records. Each log record contains the following fields:
| Field | Description |
|---|---|
| Timestamp |
The time when the record was produced, expressed in nanoseconds since the epoch. |
| Severity |
The OTLP severity number of the record, for example
|
| Body |
The log message text. |
| Trace ID, span ID |
Correlation IDs that enable a record to be linked to a trace. |
| dbid |
An attribute that identifies the Adabas database from which the record originated. |
At the resource level, the exporting service is identified as
service.name =
adabas-database.
A single exported log record looks like this:
{
  "timeUnixNano": "1724930000000000000",
  "severityNumber": 9,
  "body": { "stringValue": "%ADANUC-I-CMD, command processed" },
  "traceId": "4BF92F3577B34DA6A3CE929D0E0E4736",
  "spanId": "00F067AA0BA902B7",
  "attributes": [
    { "key": "dbid", "value": { "stringValue": "23" } }
  ]
}
The following diagram shows the log export process and what happens if the OpenTelemetry Collector cannot be reached:
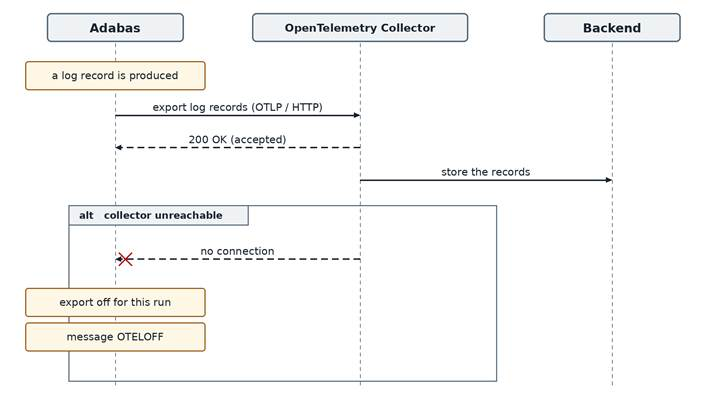
If the collector cannot be reached because its name cannot be resolved, the connection
is refused, or the connection times out, export is disabled for the remainder of the
current run, and OTELOFF message is issued once. Export
resumes only after the database is restarted. The database continues to run without
interruption.
OpenTelemetry export is configured in two places: the channel to be export is specified by the Adabas nucleus parameters, and the collector endpoint is specified by an environment variable.
| Parameter | Source | Required | Default | Description |
|---|---|---|---|---|
| Channel | Adabas parameter | Yes | None |
The signal to be exported. Currently only LOG is supported. If no channel is enabled, export remains disabled. |
| ADAOTEL_ENDPOINT | Environment variable | Yes | None | The collector address in host:port format, for example,
127.0.0.1:4318. Do not include the http:// prefix.
TLS is not supported.
|
Notes:
https:// prefix are rejected.
Enable the LOG channel in the Adabas parameters and configure the endpoint to use a local collector:
# Adabas parameter (channel)
OTEL = LOG

# environment (collector endpoint), OTLP/HTTP port 4318
ADAOTEL_ENDPOINT = 127.0.0.1:4318
Before enabling OpenTelemetry export, ensure that the following prerequisites are met:
Collector availability: An OpenTelemetry collector with an OTLP/HTTP receiver is running and can be reached from the Adabas host. The default port is 4318.
Network connectivity: The Adabas host can reach the collector endpoint, and the port is not blocked by a firewall.
Configuration values: You know the collector address in host:port format.
Enable the LOG channel in the Adabas parameters. If no channel is enabled, export remains disabled.
OTEL = LOG
In the environment in which the database is started, set the
ADAOTEL_ENDPOINT environment variable to the collector
address:
ADAOTEL_ENDPOINT=127.0.0.1:4318 # host:port, OTLP/HTTP, no http:// prefix
Start or restart the database. If the operation is successful, Adabas issues the following message:
Success: OTELSTARTED (OpenTelemetry export started
(endpoint).)
Failure to start because no valid endpoint is specified or no channel is enabled:
OTELSTARTF
Generate database activity and confirm that the log records appear in your observability backend, such as Loki or Grafana, and can be filtered by the dbid attribute.
If no data arrives because the collector unreachable, Adabas issues
OTELOFF message once, and export remains disabled until
the next database restart.
The export state is reported through Adabas messages. The endpoint value shown in the
messages is the configured ADAOTEL_ENDPOINT value.
| Message | Type | Meaning | Action |
|---|---|---|---|
| OTELSTARTED | Information |
OpenTelemetry export started (endpoint). |
No action is needed. |
| OTELSTARTF | Warning |
Export could not start because the endpoint is missing or invalid. |
Set |
| OTELOFF | Warning |
The collector endpoint is unreachable; export is disabled for the current run. |
Verify that the collector is running and reachable. Restart the database to resume export. |
Endpoint missing or invalid: ADAOTEL_ENDPOINT is not
set or cannot be parsed. The expected format is host:port, for example,
127.0.0.1:4318. Do not include the http:// or
https:// prefix. The valid port range is 1
through 65535.
Environment variable not inherited: The variable is set in a shell, but the database is started by a different launcher that does not inherit it. Set the variable in the environment in which the database is started.
No channel enabled: Enable the LOG channel in the Adabas parameters.
Wrong port: The OTLP/HTTP port is 4318. Port 4317 is used for OTLP/gRPC and does not accept these requests.
Collector not running: Start the collector before the database. If the database is already running, start the collector. Restart the database after the collector is running. In this implementation, export remains disabled for the current run after it has been disabled.
Wrong host or network: If Adabas runs in a container, 127.0.0.1 refers
to the container, not the host. Use an address through which the host can be
reached.
Firewall: Ensure that the endpoint port can be reached from the Adabas host.
To confirm that the endpoint can be reached from the Adabas host, run the following command:
curl -v http://<host>:<port>/v1/traces
If the connection is refused, Adabas reports OTELOFF for
the same reason.
Channel disabled: The LOG channel is not enabled in the Adabas parameters.
Backend filter: Confirm that you are filtering the data in the backend by the correct dbid.
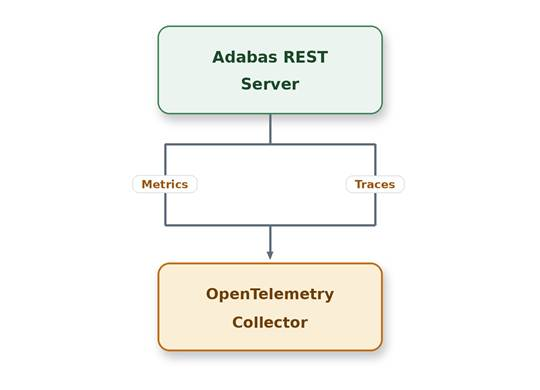
In addition to the Adabas Exporter described in Adabas OpenTelemetry Exporter, the Adabas REST Server provides its own
OpenTelemetry support for metrics and distributed tracing. The two exporters are separate:
the Adabas Exporter sends its telemetry through
ADAOTEL_ENDPOINT, whereas the REST Server exports
database-monitoring metrics and HTTP request traces through the standard
OTEL_EXPORTER_OTLP_ENDPOINT environment variable.
Adabas database monitoring is enabled through the <Metrics> section of the REST Server configuration. The <Database> entries define which Adabas databases are monitored and, therefore, which database statistics are collected for OpenTelemetry metrics.
For example, to monitor database 23:
<Metrics global="false">
    <Database dbid="23"/>
</Metrics>
Multiple databases can be configured:
<Metrics global="false">
    <Database dbid="23"/>
    <Database dbid="24"/>
    <Database dbid="25"/>
</Metrics>
A database ID can also be specified through an environment variable:
<Metrics global="false">
    <Database dbid="${METRICSDB}"/>
</Metrics>
The configured database IDs are used to initialize the database monitors. Each
monitored database is identified in the exported metrics by the
database.id attribute. If no <Database> entry is
configured, no Adabas database monitoring metrics are collected.
Note
The <Metrics> section defines which databases are monitored. It does not
configure the OpenTelemetry exporter itself.
The Adabas REST Server exports the collected database-monitoring data as OpenTelemetry metrics by using OTLP over HTTP.
The OTLP endpoint is configured through the environment variable:
OTEL_EXPORTER_OTLP_ENDPOINT
If the environment variable is not configured, the following default endpoint is used:
localhost:4318
The REST Server periodically exports the collected metrics to this endpoint. The export interval is configured through the following environment variable:
OTEL_METRIC_EXPORT_INTERVAL
The value is specified in milliseconds. The default interval is 5 seconds. For example, specify the following value for an export interval of 10 seconds:
OTEL_METRIC_EXPORT_INTERVAL=10000
When database monitoring is enabled, the following OpenTelemetry metrics are exported for each configured database.
| Metric | Description |
|---|---|
| adabas_status |
Indicates whether the database is available. A value of |
| adabas_users |
Number of active users. |
| adabas_total_command_count |
Number of executed commands. |
| adabas_lab |
Attached buffer usage. |
| adabas_labx |
Extended buffer usage. |
| Metric | Description |
|---|---|
| adabas_bp_hit_rate |
Buffer Pool hit rate. |
| adabas_fp_hit_rate |
Fixed Part hit rate. |
| adabas_plog_writes |
Number of PLOG writes. |
| adabas_thb_dwp_overflow |
Number of THB DWP overflows. |
| adabas_thb_et_sync |
Number of THB ET synchronizations. |
| adabas_work_reads |
Number of WORK reads. |
| adabas_work_writes |
Number of WORK writes. |
| Metric | Description |
|---|---|
| adabas_diff_start_io |
Difference in start I/O statistics. |
| adabas_flush_pages_sum |
Sum of flushed pages. |
| adabas_num_ios |
Number of I/O operations. |
| adabas_sync_time_data |
Synchronization time data. |
| Metric | Description |
|---|---|
| adabas_alloc_highwater |
Buffer Pool allocation high-water mark. |
| adabas_flushes_free |
Number of flushes freed. |
| adabas_io_hit_rate_high |
High I/O hit rate. |
| adabas_io_hit_rate_low |
Low I/O hit rate. |
| adabas_io_logical_reads |
Number of logical I/O reads. |
| adabas_io_physical_reads |
Number of physical I/O reads. |
| adabas_io_physical_writes |
Number of physical I/O writes. |
Command statistics are exported through the adabas_command
metric. The metric contains the following attributes:
| Attribute | Description |
|---|---|
| database.id |
Identifier of the monitored Adabas database. |
| command |
Two-character Adabas command code. |
For example:
adabas_command{database.id="23", command="OP"}
All database-monitoring metrics are associated with the
database.id attribute:
database.id = "23"
This attribute allows metrics from multiple monitored Adabas databases to be
distinguished in the OpenTelemetry backend. The
adabas_command metric also contains the command
attribute.
In addition to database metrics, the Adabas REST Server generates OpenTelemetry traces
for incoming HTTP requests by using the adabas-rest-tracer
tracer. Each incoming HTTP request is represented by an OpenTelemetry span.
The following attributes are added to the span:
| Attribute | Description |
|---|---|
| http.method |
HTTP request method. |
| http.url |
Requested URL. |
| http.host |
HTTP host. |
| http.user_agent |
Client user agent. |
| http.client_ip |
Remote client address. |
For requests that target an Adabas database, the database ID is extracted from the request path. For example:
/adabas/database/23/...
This request path results in the following additional span attribute:
adabas.database_id = "23"
This attribute allows HTTP requests to be associated with the corresponding Adabas database.
Trace data is exported using the same OTLP endpoint configured through the
OTEL_EXPORTER_OTLP_ENDPOINT environment variable.
The OpenTelemetry resource identifies the Adabas REST Server by using the following service name:
service.name = "adabas-rest-server"
The meter used for database monitoring is:
adabas-rest-metrics
The tracer used for HTTP request tracing is:
adabas-rest-tracer
These identifiers enable telemetry originating from the Adabas REST Server to be identified and filtered in an OpenTelemetry-compatible backend.