You can use the example Apama dashboard provided with the installation to display the events contained in an event log file.
The following files and folders are provided with the installation:
| File/Folder | Description |
|---|---|
| AdabasAuditingEvents.mon | The event definitions file for the Adabas events of type Auditing. |
| AdabasInternalEvents.mon | The event definitions file for the Adabas events of type Internal. |
| AdabasMonitoringEvents.mon | The event definitions file for the Adabas events of type Monitoring |
| ApamaExampleDashboard | Adabas Analytics example Apama dashboard application, this has to be imported into the Eclipse-based Software AG Designer. |
Note:
the dashboard provided is just an example of how to catch Auditing
events. Please refer to the Apama documentation for details about how to build
your own dashboard.
Before you can use the example provided, or develop your own applications in Apama, the event definitions for Adabas events have to be imported into an Apama project. In the Software AG designer, import the Adabas<type>Events.mon file into subdirectory eventdefinitions.
The files AdabasEvents.mon, AdabasInternalEvents.mon and AdabasMonitoringEvents.mon are also a part of the Apama dashboard example (ApamaExampleDashboard folder), which can be imported using the Software AG Import wizard.
 To run the example as an Apama project in the Software AG
Designer
To run the example as an Apama project in the Software AG
Designer
Open the Software AG Designer.
Select Import from the menu.
In the Import wizard, select and expand the General node, then select Existing Projects into Workspace.
Click the button, and the click on the button in the Import Project step.
Navigate to <installation directory>\AdabasAnalytics\apama\ApamaExampleDashboard and select that folder.
In the Options panel of the Import Projects dialog, check the Copy projects into workspace check box.
To run the example, right-click the project and select Run As -> Apama Application from the Apama Developer Perspective. Then click on the button in the Launch Control Panel of the Apama Workbench Perspective.
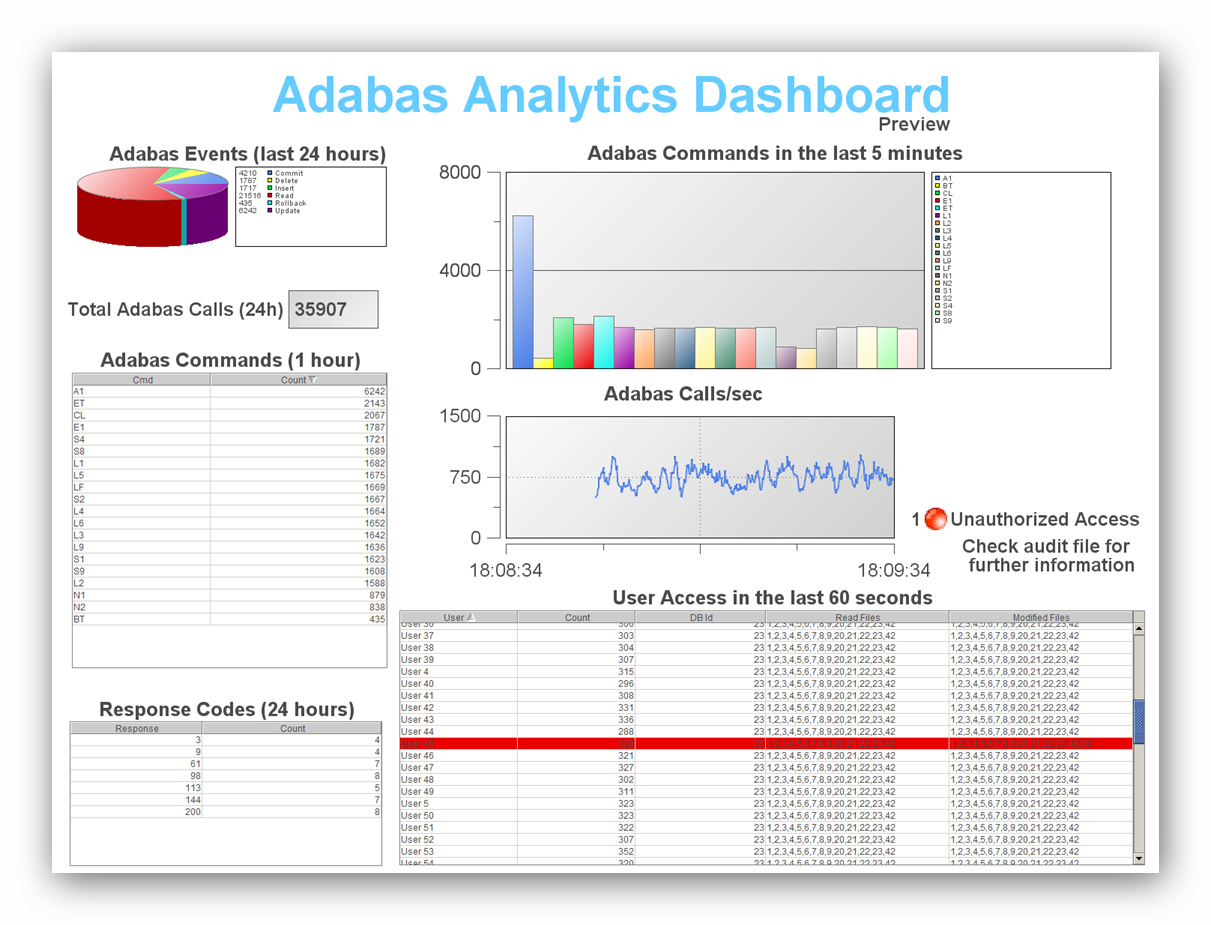
The following shows an example of how the dashboard might look: