
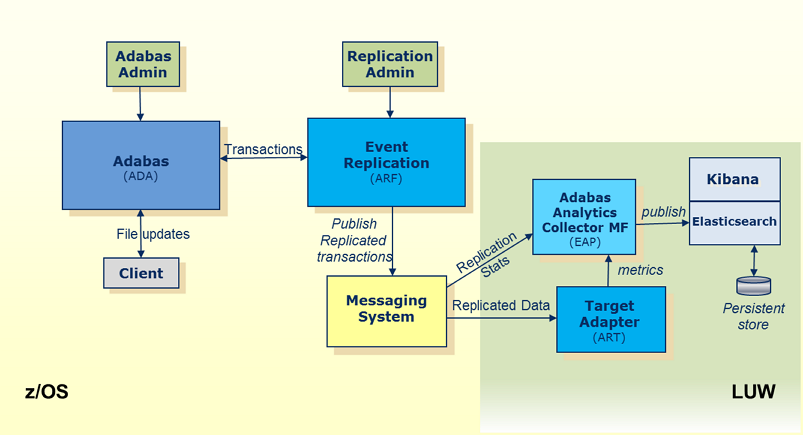
Replication Monitoring is a tool that will allow users to monitor the status and progress of data being replicated by the Event Replicator for Adabas. While statistical information (metrics) may be gathered by issuing DRPLSTAT operator commands, utilizing the Replication Monitoring tool provides an automated way to collect these metrics. The metrics may then be graphically viewed using the Kibana application. Kibana, along with ElasticSearch analytics engine, may be installed under a Windows, UNIX or Linux operating system.
Activating the Replication Monitoring subsystem is achieved by setting the value of
the global variable parameter, STATINTERVAL,
to a value other than zero. A new Destination, with a destination type (DTYPE)
of ETBROKER or MQSERIES (or NULL for test purposes), should then be created,
and the DSTATLOG
parameter set to "YES". The result of setting up
this new Destination will be for the Replication metrics to be sent to the
Adabas Analytics component of Replication Monitoring.
One additional parameter is the
DEVENTLOG.
Setting this to "YES" will result in events to be
sent to the Adabas Analytics component. Examples of events include
Destination(s) being Opened or Closed, or Subscription File(s) being Activated
and Deactivated.
Another aspect of Replication Monitoring is the Heartbeat feature. There is one new
parameter that needs to be set to activate this feature:
DHBINTERVAL.
The DHBINTERVAL determines how often the Event Replicator Server sends
a heartbeat to a Destination. The Destination must be one used to send
replication data to the Event Replicator Target Adapter.
Using Kibana, it is possible to visualize a number of metrics provided by the Event Replicator Server. Each visualization may be of a single or multiple metrics, or a customized dashboard may be created to have a single view of a number of visualizations. Then, with the flexibility of ElasticSearch, the dashboards may facilitate different time ranges of metrics; as much as one year, showing a view of the replication workload trends.
The Replication metrics have a number of categories, which are described in more detail in the section Replication Monitoring Metrics. The categories are as follows:
Global General
Statistics
This provides an overview about the number of transactions
received and sent by the Event Replicator Server.
Subscription
Where a number of Subscriptions may have been defined to the
Event Replicator Server, an overview of the activities of any/all subscriptions may be
monitored. This includes any Replication Initial State requests (i.e. Initial
State requests not done asynchronously using the ADARIS utility).
Subscription
file
For each Subscription, one or more Subscription files may be
defined. Monitoring these provides details about the commands being issued for
each file.
Destination
Monitoring the Destinations provides an overview of the number of
items being sent to specific targets and the amount of data. If Destination is
manually or automatically closed, and logging is active, the amount of data
being logged and de-logged may be tracked, i.e. Destination SLOGing activities
are.
Destination file for an Adabas
destination
Where the Replication is from Adabas to Adabas. the modifications
being made to the target destination files may be tracked.
Subtask
Where the Destination types are either EntireX Broker or MQ
Series, an overview of the replicated transactions may be monitored.
Input
queue
If Node to Node Replication is being used or other requests are
being sent by an application to the Event Replicator Server, these may be monitored.
SLOG
Under general statistics, the usage of the SLOG system file may be
monitored. The number of items logged and de-logged from the file may be
tracked.
Events
When Replication is active, a number of events may occur during
normal processing, e.g. a Destination may become closed or opened, a file may
be inactive or active, a destination may become full, the Replication Pool may
become short on storage. These events would be written to the console but, with
Replication Monitoring, a specific visualization allows an overview of all events to be
viewed.
Event Replicator Target Adapter
(ART)
The Event Replicator Target Adapter subsystem activities may, similarly, be tracked. There
are a number of java beans that Event Replicator Target Adapter provides to monitor replicated
transactions being processed. This will be done for each target (e.g. RDBMS,
JMS, Terracotta). These metrics will also be viewable from Kibana, showing
visualizations of the trends or current status of Event Replicator Target Adapter. See also
Reviewing Event
Replicator Target Adapter Statistics for further details.
Heartbeat
When the Heartbeat feature is active, the heartbeats sent to the
Event Replicator Target Adapter, will have various timestamps. These timestamps will reflect the latency
at various points; points that would indicate if the delivery of the replicated
data is being delayed. Examples would be, if the workload being sent to the
Event Replicator Server and the data had to be written to the SLOG, or if it was queued up in
the EntireX Broker or MQ Series.
Once the heartbeat reaches the Event Replicator Target Adapter, additional information is added before the heartbeat metrics are passed on to the Adabas Analytics component. In short, the heartbeat will provide information that reflects the rate at which replicated data is being processed and is likely to change based on the number of transactions being replicated.
See also Reviewing Event Replicator Target Adapter Statistics for further details.