
This document describes the utility "ADAMON".
The following topics are covered:
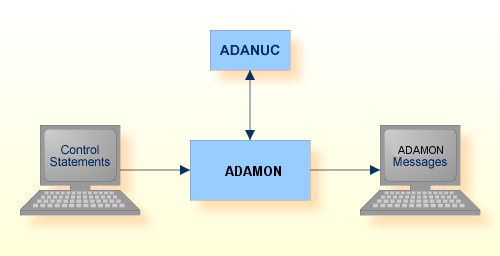
The ADAMON utility is used to monitor an Adabas session with the aim of collecting performance data. The type of information collected is determined by the setting of the DISPLAY parameter; the information is usually displayed on a "per second" basis. The information collected can be presented as a set of numbers or as a basic graphical output. An ADAMON session is terminated by typing CTRL/C, or when the value specified for the LOOP parameter has been reached - then a statistical summary of the monitored session is displayed.
This utility is a multi-function utility.
| Data Set | Environment Variable/ Logical Name |
Storage Medium | Additional Information |
|---|---|---|---|
| Control statements | stdin/ SYS$INPUT |
Utilities Manual | |
| ADAMON messages |
stdout/ SYS$OUTPUT |
Messages and Codes |
The utility writes no checkpoints.
The following control parameters are available:
D    [NO]DATETIME

M    DBID = number

D    DISPLAY = keyword

D    [NO]GRAPHICAL

D    INTERVAL = number

D    LOOPS = number

     RCMD

     SUMMARY = filename

     SUMMARY_COMPARE = filename

     SUMMARY_COMPARE_FILES = (filename,filename)

     SUMMARY_INPUT = filename
[NO]DATETIME
If this parameter is set to DATETIME, each monitoring line with non-graphical output will be preceded by the current date and time. The default is NODATETIME.
DBID = number
This parameter selects the database to be used. The database must be active for all functions with the exception of DISPLAY = BACKUP.
DISPLAY = keyword
This parameter displays database information in accordance with the keyword specified. The display is refreshed at intervals specified by the parameter INTERVAL (default of 3 seconds). Please refer to the DISPLAY examples in the section ADAOPR for explanations of the information displayed.
The following keywords are available:
| Keyword | Meaning |
|---|---|
| ACTIVITY | Displays the throughput of a database, for example the number of commands per second. This keyword is the default if the nucleus is active. |
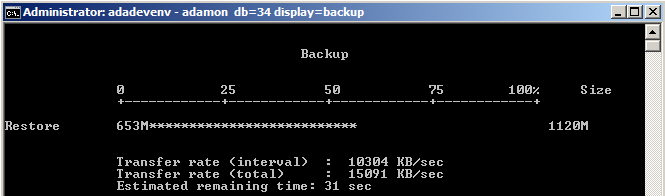
| BACKUP | Displays a graph which monitors the execution of an ADABCK DUMP or RESTORE function. The values displayed are normalized to full blocksizes, which can be different from the real backup/restore space because of 'used size compression'. The output is always graphically oriented. This keyword can also be used if the nucleus is not active. This keyword is the default if the nucleus is not active. |
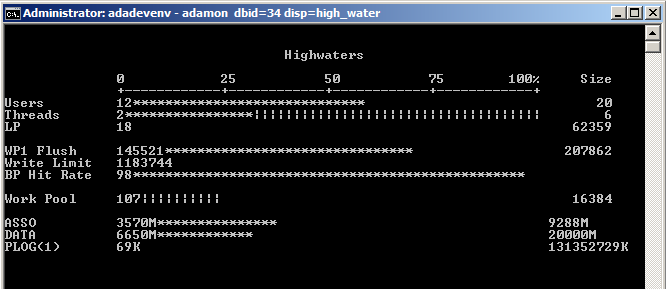
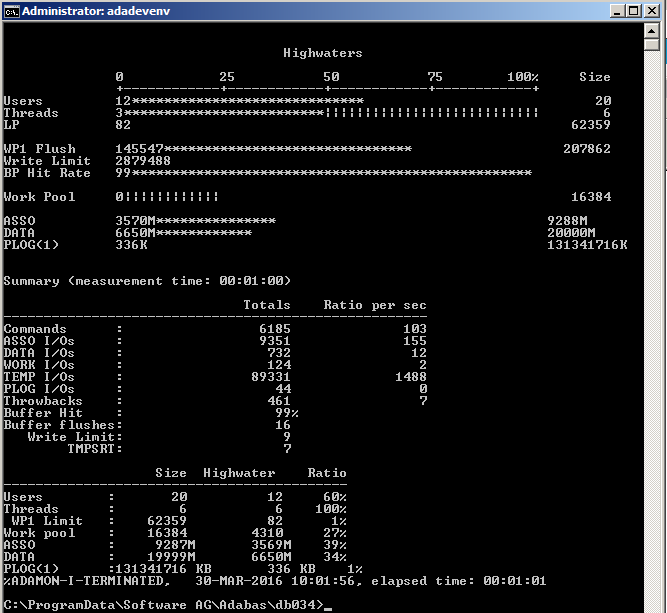
| HIGH_WATER | Displays some important highwater values. The output is always graphically oriented. The bold line gives the current value in percent, the dashed line shows the highwater value. If there is only a bold line, the current and the high water values are identical. The 'Write Limit' line shows the number of modified blocks in percent until the flush limit is reached - at 100%, usually a buffer flush will be started. The number given within the line shows the modified space in bytes. The 'WP1 Flush' line shows the number of modified WORK part 1 blocks from the most recent buffer flush record - if the 100% point is reached, a buffer flush will be started. The 'Hit rate' lines show the overall hit rate (dashed line) and the current rate that occurred during the measured interval (bold line). The 'ASSO' and 'DATA' lines show the ratio between used and total allocated container space. The 'PLOG' line shows the ratio between the used and allocated space for the protection log. The numbers in these data set lines are either given in KB, MB or GB units. Note that the PLOG on file system always shows 100% |
| INDEX | Displays some counters and exceptions that occurred during index update (for internal reasons). |
| IO | Displays the number of physical I/Os of the specific Adabas container files, per second. For each container type (ASSO, DATA) only the first 10 extents can be displayed. I/Os to upper extents are collected in ASSOx or DATAx. |
Furthermore, if an exceptional situation is detected during collection of the data, additional information is displayed on the screen. In the non-graphical mode it is displayed in the final column, in the graphical mode, the status is shown in the base line. The following status information can be detected:
- BF_ACTIVE
A buffer flush is in progress.
- SPACE_WAIT
Threads waiting for work pool space on complex commands.
- ET_SYNC
The nucleus is in ET_SYNC mode, which means no new transactions will be started.
- HYX
The nucleus is executing a hyperexit.
- UEX
The nucleus is executing a user exit.
- LARGE_DWP
The internal work pool is so large that it extends into the buffer pool.
- SHUTDOWN-P
Nucleus shutdown in progress.
- SHUTDOWN-C
Nucleus shutdown completed.
- CRASHED
Nucleus abnormally terminated.
If an AUTORESTART is executing, ADAMON can monitor and display the phase number (1, 2, 3 or 4) and the number of processed blocks. Usually, phase 3 takes the most time, and the percentage of processed blocks is displayed. This is done independently of the selected function. When the AUTORESTART completes, it PT_RETs to the function requested.
Note:
Refer to Database
Monitoring and Tuning for further information about the
buffer flush.
[NO]GRAPHICAL
Setting this option to GRAPHICAL switches the output to the graphical format. For the display functions BACKUP and HIGH_WATER, only the graphical format is supported. The default is NOGRAPHICAL.
INTERVAL = number
This parameter specifies the data-collection sampling interval in seconds.
The default interval is 3 seconds.
LOOPS = number
This parameter limits the number of data collection loops.
By default, ADAMON loops continuously. Data collection can be terminated with CTRL/C.
The parameter RCMD is only relevant for customers using the Adabas Event Replicator with Adabas - Adabas (A2A) Replication. If this parameter is specified, two additional columns are added to the output for DISPLAY=ACTIVITY:
| Column | Meaning |
|---|---|
| Rec. per sec | Number of recorded commands |
| Repl. per sec | Number of replicated commands |
Additionally, the number of replication commands and also the ration of replication commands per second will be added to the summary at the end of the ADAMON run.
Note:
If no replications were pending when ADAMON started, and no
replications were pending when ADAMON ended, it may nevertheless be that the
total number of “replication commands recorded” is larger than the total number
of “replicated commands”; this is because commands that are stored on
replication system files belonging to a transaction that is rolled back, are
removed again from the replication system files without replicating
them.
SUMMARY = filename
The parameter SUMMARY can be used to write the summary for DISPLAY=ACTIVITY into a file. The resulting file is a binary file. The parameters INTERVAL and LOOPS can be used to limit the runtime of ADAMON.
SUMMARY_COMPARE = filename
The parameter SUMMARY_COMPARE can be used to create a compare report. The intention is to have a reference file already created with SUMMARY = filename and then to use this reference file as a base for the current ADAMON run. The parameters INTERVAL and LOOPS can be used to limit the runtime of ADAMON.
SUMMARY_COMPARE_FILES = (filename,filename)
The parameter SUMMARY_COMPARE_FILES can be used to compare two ADAMON summary files.
SUMMARY_INPUT = filename
The parameter SUMMARY_INPUT can be used to display the contents of the summary file created with SUMMARY=filename. The DBID parameter is not required.
> adamon db=36
%ADAMON-I-STARTED,      29-MAR-2016 11:53:29, Version <version number>

Database 36, startup at 23-MAR-2016 16:58:41
ADANUC Version <version number>, PID 525


Commands      I/Os per second      Throw   Buffer pool
per sec   ASSO  DATA  WORK  PLOG   backs   Hit  Flushs
------------------------------------------------------
       0     0     0     0     0       0   100%      0
       0     1     9     0     0       0    99%      0
     101     2     2    10     3      43    99%      0
       0     0     0     0     0       0   100%      0
       0     0     0     0     0       0   100%      0
      13     1     0     1     0       9    99%      0
       6     0     0     1     0       2   100%      0
      12     0     0     0     0       7   100%      0
      99     3     0    19     2      50    99%      0
       0     0     0     0     0       0   100%      0
       0     0     0     0     0       0   100%      0
      37     0     0     3     1      24   100%      0
^C

Summary (measurement time: 00:00:33)

                              Totals    Ratio per sec
-----------------------------------------------------
Commands      :                  801               24
ASSO I/Os     :                   15                0
DATA I/Os     :                   31                0
WORK I/Os     :                   97                2
TEMP I/Os     :                  126                3
PLOG I/Os     :                   13                0
Throwbacks    :                  135                4
Buffer Hit    :                   99%
Buffer flushes:                    0

%ADAMON-I-TERMINATED,   29-MAR-2016 11:54:04, elapsed time: 00:00:35
If you don’t specify the DISPLAY parameter, this is equivalent to the default DISPLAY=ACTIVITY.
> adamon db=34 rcmd
%ADAMON-I-STARTED,      29-MAR-2016 12:53:53, Version <version number>

Database 34, startup at 29-MAR-2016 12:53:32
ADANUC Version <version number>, PID 6488


Commands Record.  Repl.       I/Os per second      Throw   Buffer pool
per sec  per sec per sec  ASSO  DATA  WORK  PLOG   backs   Hit  Flushs
----------------------------------------------------------------------
     248      60      14     0     0    48     0       0   100%      0
     258      57       7     1     0    44     0       0    99%      0
     229      60      14     0     0    43     0       0   100%      0
     263      58      14   110    18    53     0       0   100%      1
     274      60       7     0     0    40     0       0   100%      0
^C

Summary (measurement time: 00:00:15)

                              Totals    Ratio per sec
-----------------------------------------------------
Commands      :                 3809              253
Recorded      :                  878               58
Replicated    :                  160               10
ASSO I/Os     :                  330               22
DATA I/Os     :                   53                3
WORK I/Os     :                  679               45
TEMP I/Os     :                    0                0
PLOG I/Os     :                    0                0
Throwbacks    :                    0                0
Buffer Hit    :                   99%
Buffer flushes:                    1
    WP1 Limit:                     1


%ADAMON-I-TERMINATED,   29-MAR-2016 12:54:04, elapsed time: 00:00:11
If you specify the RCMD parameter, DISPLAY=ACTIVITY additionally includes the columns “Rec. per second” (replication commands recorded) and “Repl. per sec” (replicated commands per second).
If Adabas-to-Adabas replication is defined for a database, the summary additionally contains the values for “Rec. per second” (replication commands recorded) and “Repl. per sec” (replicated commands per second).
C:\ProgramData\Software AG\Adabas\db034> adamon db=34 display=backup
This command results in the following screen that is refreshed with the current values every 3 seconds - the refresh rate can be modified with the INTERVAL parameter:
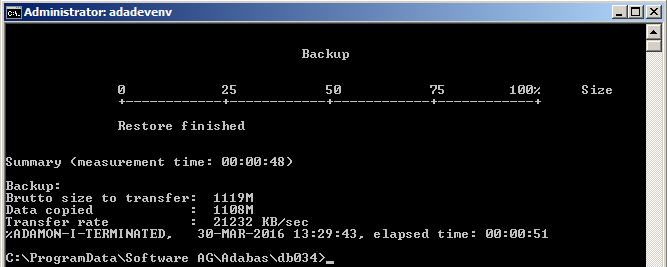
After pressing Control C when the dump or restore is finished, a summary is displayed:
C:\ProgramData\Software AG\Adabas\db034> adamon dbid=34 display=high_water
This command results in the following screen that is refreshed with the current values every 3 seconds – the refresh rate can be modified with the INTERVAL parameter:
When you enter Control C (instead of entering Control C, you can also stop ADAMON with the LOOPS parameter), a summary is added to the output:
> adamon db=36 display=io
%ADAMON-I-STARTED,      29-MAR-2016 14:19:17, T-Version 6.5.0.0 (Solaris 64Bit)

Database 36, startup at 23-MAR-2016 16:58:41
ADANUC T-Version 6.5.0.0, PID 525


                        I/Os per sec
  A1   A2   A3   A4   A5   D1   D2   D3   D4   W1 PLOG    T
------------------------------------------------------------
   0    0    0    0    0    0    0    0    0    0    0    0
   0    0    0    0    0    0    0    0    0   10    1    0
   0    0    0    0    0    0    0    0    0  102    5    0
   0    0    0    0    0    0    0    0    0   63    6    0
   0    0    0    0    0    0    0    0    0  134    8    0
   0    0    0    0    0    0    0    0    0  127    8    0
   0    0    0    0    0    0    0    0    0   91    6    0
   0    0    0    0    0    0    0    0    0  105    7    0
   0    0    0    0    0    0    0    0    0  118    5    0
   0    0    0    0    0    0    0    0    0    0    0    0
   0    0    0    0    0    0    0    0    0    0    0    0
   0    0    0    0    0    0    0    0    0   64    5    0
   0    0    0    0    0    0    0    0    0   99    7    0
   0    0    1    0    0    0    0    0    0   88    6    0
   0    0    0    0    0    0    0    0    0   85    5    0
   0    0    0    0    0    0    0    0    0   81    7    0
   0    0    0    0    0    0    0    0    0  120    6    0
   0    0    0    0    0    0    0    0    0   79    5    0
^C

Summary (measurement time: 00:00:51)

                              Totals    Ratio per sec
-----------------------------------------------------
Commands      :                29597              580
ASSO I/Os     :                    1                0
DATA I/Os     :                    0                0
WORK I/Os     :                 4081               80
TEMP I/Os     :                    0                0
PLOG I/Os     :                  247                4
Throwbacks    :                 2913               57
Buffer Hit    :                   99%
Buffer flushes:                    0

ASSO1  I/Os  :        0                0
ASSO2  I/Os  :        0                0
ASSO3  I/Os  :        1                0
ASSO4  I/Os  :        0                0
ASSO5  I/Os  :        0                0
DATA1  I/Os  :        0                0
DATA2  I/Os  :        0                0
DATA3  I/Os  :        0                0
DATA4  I/Os  :        0                0
WORK1  I/Os  :     4081               80
TEMP   I/Os  :        0                0
%ADAMON-I-TERMINATED,   29-MAR-2016 14:20:08, elapsed time: 00:00:51
In the first step of this example, a summary reference file is created:
>adamon db=34 summary=mon.sum interval=1 loops=100
%ADAMON-I-STARTED,      30-MAR-2016 10:47:48, Version <version number>

Database 34, startup at 30-MAR-2016 10:00:43
ADANUC Version <version number>, PID 2244


Summary file "mon.sum" created
%ADAMON-I-TERMINATED,   30-MAR-2016 10:49:30, elapsed time: 00:01:42
Then the contents of the summary reference file are displayed:
>adamon db=34 summary_input=mon.sum interval=1 loops=100
%ADAMON-I-STARTED,      30-MAR-2016 11:29:41, Version <version number>

Database 34, startup at 30-MAR-2016 10:00:43
ADANUC Version <version number>, PID 2244


Summary (measurement time: 00:01:39)

                              Totals    Ratio per sec
-----------------------------------------------------
Commands      :                16053              162
ASSO I/Os     :                 2787               28
DATA I/Os     :                 1694               17
WORK I/Os     :                  420                4
TEMP I/Os     :                90434              913
PLOG I/Os     :                   54                0
Throwbacks    :                  355                3
Buffer Hit    :                    -
Buffer flushes:                   18

%ADAMON-I-TERMINATED,   30-MAR-2016 11:29:41, elapsed time: 00:00:00
In the final step, the summary is compared with the current activity of the database:
>adamon db=34 summary_compare=mon.sum interval=1 loops=100
%ADAMON-I-STARTED,      30-MAR-2016 11:27:13, Version <version number>

Database 34, startup at 30-MAR-2016 10:00:43
ADANUC T-Version <version number>, PID 2244


Monitor Summary |        Reference         | Current
----------------+--------------------------+-------------------------
From date       : Wed Mar 30 10:59:18 2016 | Wed Mar 30 11:27:13 2016
To date         : Wed Mar 30 11:01:00 2016 | Wed Mar 30 11:28:55 2016
Duration in sec :                        99 |                        99
DBID            :                        34 |                       34
Version         :          <version number> |         <version number>
Structure level :                        1 |                        1
----------------+--------------------------+-------------------------

Monitor Summary |   Reference   |    Current    |   Absolute    |  Percentaged
----------------+---------------+---------------+---------------+-------------
Commands        :          16053 |          16326 |          +273 |         +2%
RPLCMDs         :              0 |              0 |            +0 |         +0%
Rec.            :              0 |              0 |            +0 |         +0%
Repl.           :              0 |              0 |            +0 |         +0%
ASSO I/Os       :           2787 |           5904 |         +3117 |       +112%
DATA I/Os       :           1694 |           4859 |         +3165 |       +187%
WORK I/Os       :            420 |            416 |            -4 |         -1%
TEMP I/Os       :          90434 |         145384 |        +54950 |        +61%
PLOG I/Os       :             54 |             82 |           +28 |        +52%
Throwbacks      :            355 |            706 |          +351 |        +99%
Buffer Hit      :             99 |             99 |            +0 |         +0%
Buffer flushs   :             18 |             27 |            +9 |        +50%

%ADAMON-I-TERMINATED,   30-MAR-2016 11:28:55, elapsed time: 00:01:42
Instead of comparing the reference file with the current database activity, you can also create a second summary file and then compare the two files:
>adamon db=34 summary=mon1.sum interval=1 loops=100
%ADAMON-I-STARTED,      30-MAR-2016 11:49:09, Version <version number>

Database 34, startup at 30-MAR-2016 10:00:43
ADANUC Version <version number>, PID 2244


Summary file "mon1.sum" created
%ADAMON-I-TERMINATED,   30-MAR-2016 11:50:51, elapsed time: 00:01:42

>adamon db=34 summary_compare_files=(mon.sum,mon1.sum)
%ADAMON-I-STARTED,      30-MAR-2016 12:02:19, Version <version number>

Monitor Summary |        Reference         | Current
----------------+--------------------------+-------------------------
From date       : Wed Mar 30 10:59:18 2016 | Wed Mar 30 11:49:10 2016
To date         : Wed Mar 30 11:01:00 2016 | Wed Mar 30 11:50:51 2016
Duration in sec :                        99 |                        99
DBID            :                        34 |                       34
Version         :          <version number> |          <version number>
Structure level :                        1 |                        1
----------------+--------------------------+-------------------------

Monitor Summary |   Reference   |    Current    |   Absolute    |  Percentaged
----------------+---------------+---------------+---------------+-------------
Commands        :          16053 |          14852 |         -1201 |         -7%
RPLCMDs         :              0 |              0 |            +0 |         +0%
Rec.            :              0 |              0 |            +0 |         +0%
Repl.           :              0 |              0 |            +0 |         +0%
ASSO I/Os       :           2787 |           5043 |         +2256 |        +81%
DATA I/Os       :           1694 |           6627 |         +4933 |       +291%
WORK I/Os       :            420 |            416 |            -4 |         -1%
TEMP I/Os       :          90434 |         174211 |        +83777 |        +93%
PLOG I/Os       :             54 |             57 |            +3 |         +6%
Throwbacks      :            355 |            554 |          +199 |        +56%
Buffer Hit      :             99 |             99 |            +0 |         +0%
Buffer flushs   :             18 |             31 |           +13 |        +72%

%ADAMON-I-TERMINATED,   30-MAR-2016 12:02:19, elapsed time: 00:00:00
> adamon db=150

%ADAMON-I-STARTED,      25-OCT-2018 10:51:43, Version <version number>

Database 150, startup at 22-OCT-2018 17:14:39
ADANUC Version <version number>, PID 12264

Commands      I/Os per second      Throw   Buffer pool
per sec   ASSO  DATA  WORK  PLOG   backs   Hit  Flushs
------------------------------------------------------
       0     0     0     0     0       0     -       0
     497    87    54   241     0       0    99%      1
     814     0     2   350     0       3    99%      0
     799   114    43   365     0       0   100%      1
     949   114    49   404     0       0   100%      1
     849     0     5   428     0       0    99%      0
       0     0     0     0     0       0     -       0
       0     0     0     0     0       0     -       0
     710   116    54   321     0       1   100%      1
     867   132    59   537     0       0    99%      2
    1002   112    51   674     0       0   100%      1  BF_ACTIVE
     865     0     0   421     0       1   100%      0
     455   112    53   241     0       0   100%      1
       0     0     0     0     0       0     -       0

Commands      I/Os per second      Throw   Buffer pool
per sec   ASSO  DATA  WORK  PLOG   backs   Hit  Flushs
------------------------------------------------------
       0     0     0     0     0       0     -       0
     643     0     0   273     0       0   100%      0
     960   113    62   441     0       0   100%      1
     962     0     0   431     0       0   100%      0
     908   117    60   433     0       0   100%      1
     430     0     0   243     0       0   100%      0
       0     0     0     0     0       0     -       0

Summary (measurement time: 00:01:36)
                              Totals    Ratio per sec
-----------------------------------------------------
Commands      :                35118              365
ASSO I/Os     :                 3044               31
DATA I/Os     :                 1465               15
WORK I/Os     :                17397              181
TEMP I/Os     :                    0                0
PLOG I/Os     :                    0                0
Throwbacks    :                    5                0
Buffer Hit    :                   99%
Buffer flushes:                   10
    WP1 Limit:                     9
     IgnoreBlk:                    1

%ADAMON-I-TERMINATED,   25-OCT-2018 10:53:22, elapsed time: 00:01:39
The value in the column Buffer pool Flushs is the number of times that the buffer pool is flushed while the monitoring is active.